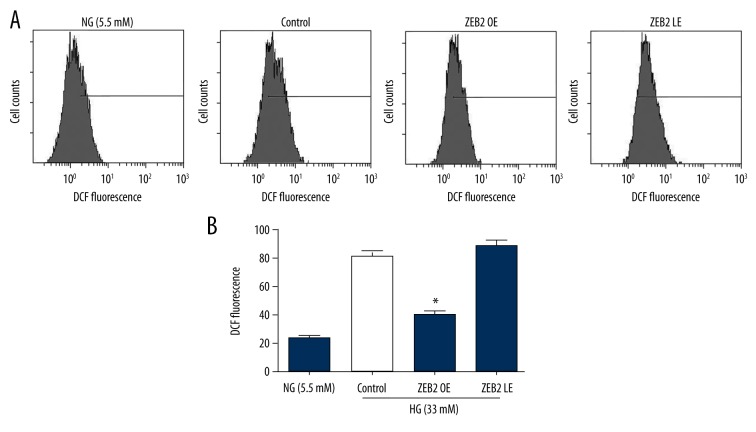
Figure 4.
The levels of intracellular ROS were detected by flow cytometry. (A) ROS in HUVECs that were treated with different concentrations of glucose (5.5 mM, 33 mM) was analyzed after 24 h by flow cytometry. (B) Data of ROS expression were expressed as mean ±SD of 4 independent groups. The superscript letter on columns represented that * P<0.05 compared with control group.

