
Figure 2.
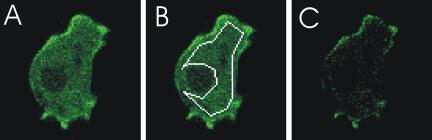
Analysis of sGC-GFP localization in the cytosol and at the membrane. (A) Confocal image of 5-h–starved sGC-GFPoe cells; exposure time is 8 s. The fluorescence intensity of the cytosol is rather homogeneous, but at the membrane fluorescence was nonuniformly distributed and predominantly found in protrusions. (B) The average fluorescence intensity of the cytosol was determined by averaging the pixel values of a large area of the cell containing only cytosol pixels. This value was subtracted from each pixel in A. The remaining fluorescence, that is mainly membrane-associated, is displayed in C.