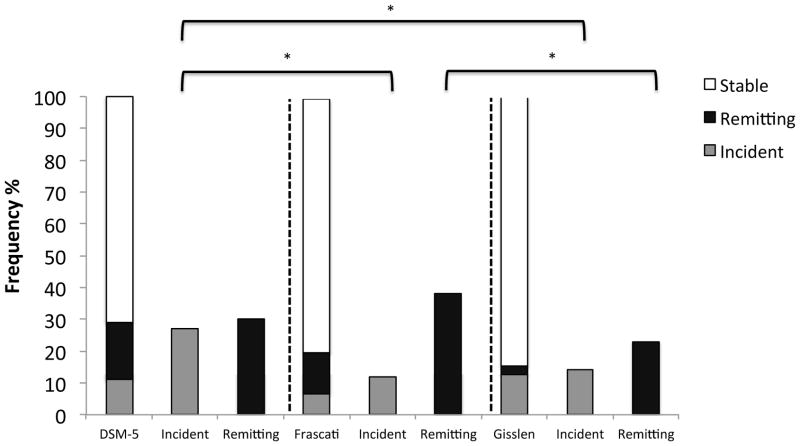
Figure 5.
Stacked bar charts show the rates of incident, stable, and remitting neurocognitive disorders for the total longitudinal HIV+ sample (N=118) across the three diagnostic criteria. In the secondary bar charts, the percentage of incident and remitting neurocognitive disorders are displayed using only those individuals who would were eligible for a change in cognitive status (i.e., incident cases for only persons who were neurocognitively normal at baseline and remitting cases for only those individuals who were neurocognitively impaired at baseline).

