
Figure 7.
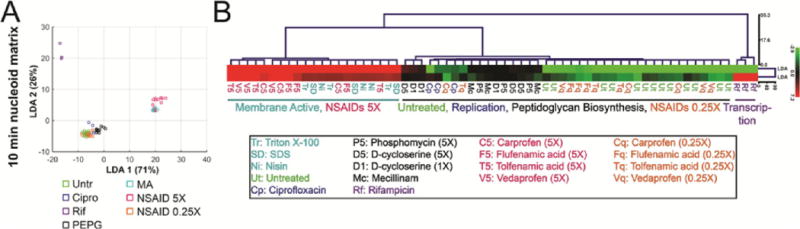
LDA and clustering analysis of cells treated with antibiotics for 10 min. (A) Scatterplot of LDA scores generated from coefficients of LDA from nucleoid measurement data after treatment with indicated antibiotics for 10 min. NSAID data were not utilized to generate the coefficients. (B) Euclidean distance hierarchical cluster analysis of LDA scores graphed in panel A using LDA1 and LDA2 scores. Points on scatterplots and treatment names in tree are color-coded based on pathway affected: controls (green), replication (blue), transcription (purple), peptidoglycan (black), membrane active (cyan), NSAIDS at 5× MIC (magenta), and NSAIDs at 0.25× MIC (orange). Data used to generate graphs and trees can be found in the Supporting Information. Antibiotic concentrations are in Table S2.