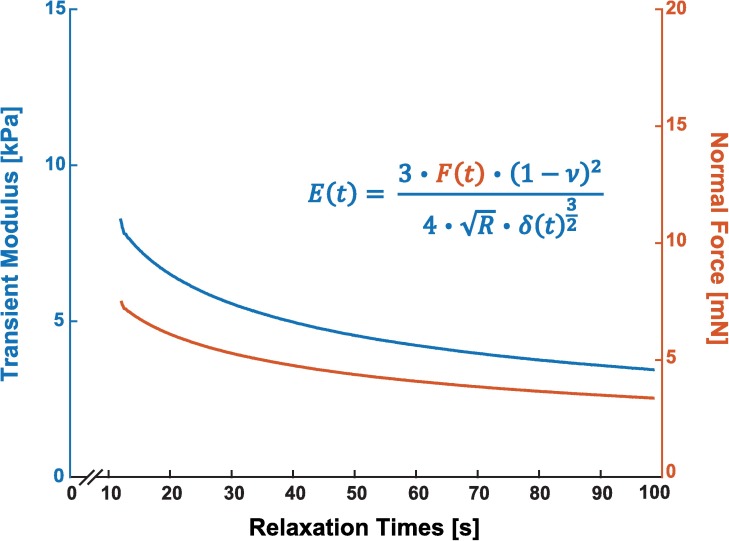
Fig 2. Effective modulus of a 0.4% agarose gel sample is determined by a time-dependent rearrangement of the Hertz contact model.
Force displacement data (lower orange curve) is converted to the effective modulus (upper blue curve) using the Hertz contact model for a sphere and a half space (Eq 2, inset). Samples were indented at a rate of 15 μm/s followed by a stress-relaxation phase where the base of the cantilever is held at a constant strain until the tissue fully relaxes.

