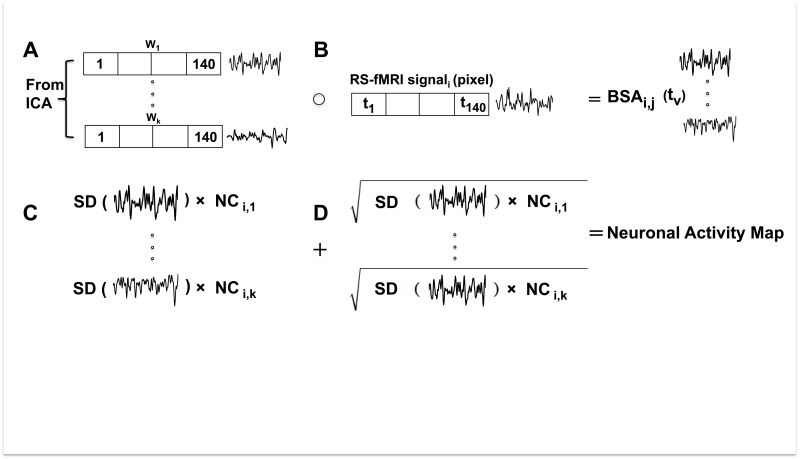
Fig 1. Schematic diagram of the brain activity metric calculated from the RS-fMRI signal in one pixel.
The signal shown is a graphical representation of the vector data. (A) Neuronal time courses (W) are defined by the ICA and verified using a goodness of fit calculation, multiple template matching method and a support vector machine classifier. (B) The Hadamard product of each neuronal time course is taken with the RS-fMRI signal. (C) The standard deviation of the resulting signal is multiplied by the neuronal component. (D) The square root of the contribution of each neuronal time course is added to create a measure of neuronal activity.

