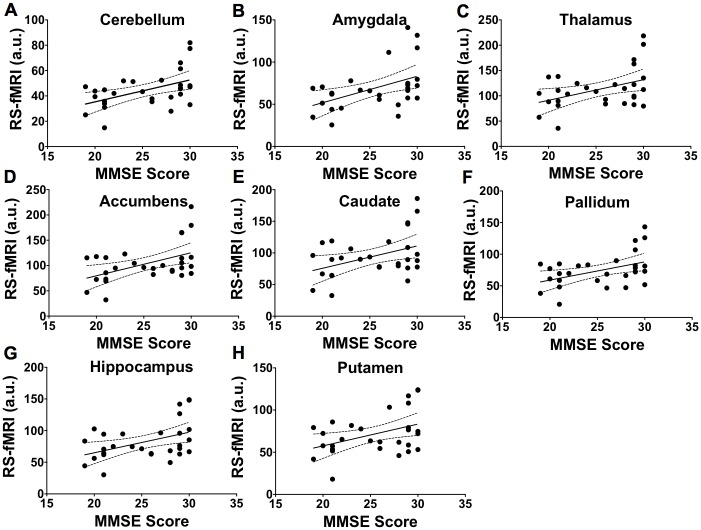
Fig 7. Relationship between mean brain activities measured using RS-fMRI and cognition function.
The 95% confidence intervals for the regressions are shown as dotted lines. Association between MMSE score and brain activity in cerebellum (r = 0.50, p = 0.007, A), amygdala (r = 0.47, p = 0.009, B), thalamus (r = 0.42, p = 0.02, C), accumbens (r = 0.48, p = 0.008, D), caudate (r = 0.41, p = 0.02, E), pallidum (r = 0.44, p = 0.01, F), hippocampus (r = 0.44, p = 0.01, G), and putamen (r = 0.41, p = 0.02, H). These correlations were not significant following Bonferroni correction for multiple comparisons.

