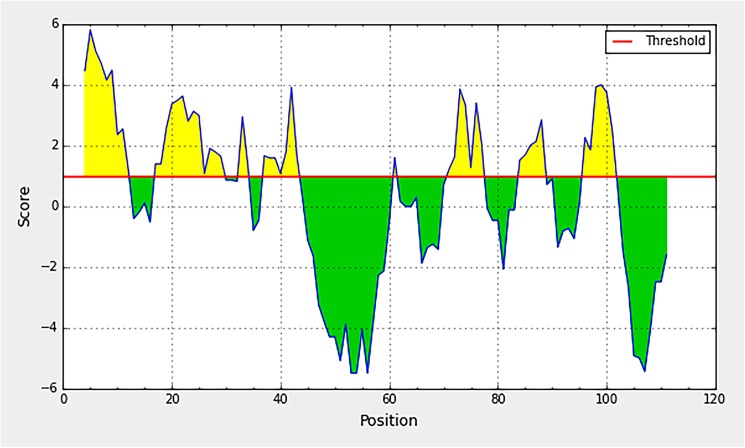
Fig 3. Parker hydrophilicity profile of the C protein.
The horizontal axis indicates amino acids residue number and the vertical axis indicates the hydropathy. The profile shown is the output of the sequence of DENV1 isolate AY713476. This profile was 90% similar across all 200 isolates used for the analysis.

