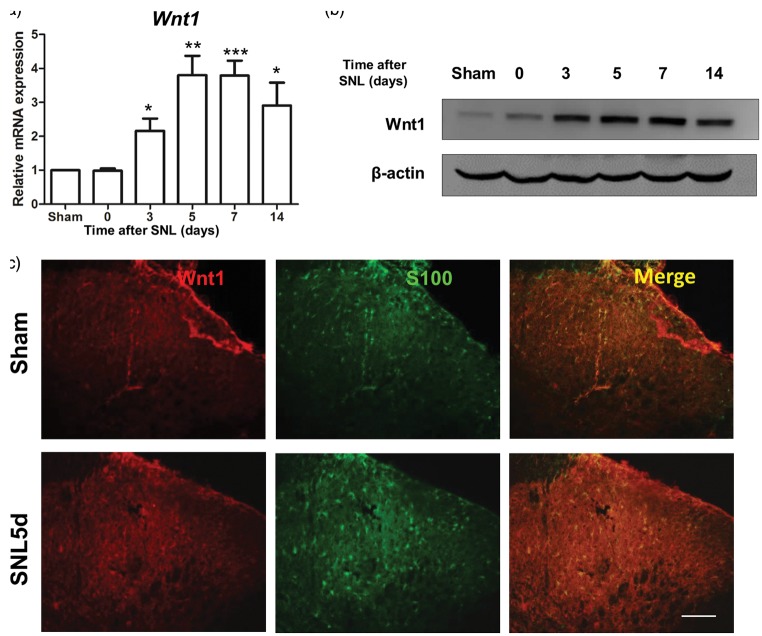
Figure 3.
Wnt1 expression increased in astrocytes in the dorsal horn after SNL. (a) qPCR result showing the time course of Wnt1 mRNA expression in DRG lesions after SNL. (b) Western blot showing the time course of Wnt1 protein expression in SNL lesions. (c) Distribution and cellular colocalization of Wnt1 expression (red) in the superficial dorsal horn with activated astrocytes (S100, green). Data are shown as mean ± SEM (n = 4 in each group in a). *p < 0.05, ***p < 0.001 versus sham in the corresponding group (one-way analysis of variance). (Scale bar, 100 µm).

