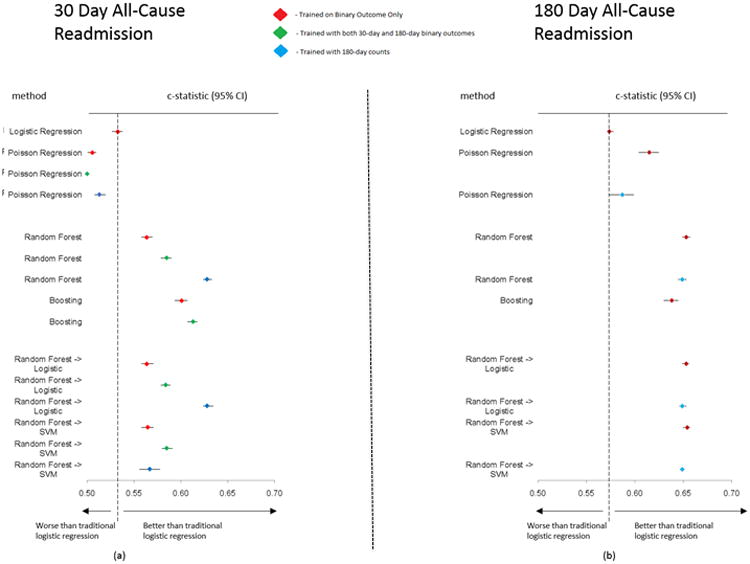
Figure 2. Forest plots for c-statistics and 95% confidence intervals for each method with respect to prediction of 30-day and 180-day all-cause readmission (2a and 2b).

Diamond represents c-statistic and the line represents the 95% confidence interval. SVM, Support Vector Machine. Color coding for model training: Red - trained in 30-day binary case only; Green - trained with 30-day and 180-day binary outcome; Blue - trained with 180-day counts case.
