
Figure 6. Deciles of algorithm risk versus readmission rates (%) for the best 30-day heart failure-only models for each method.
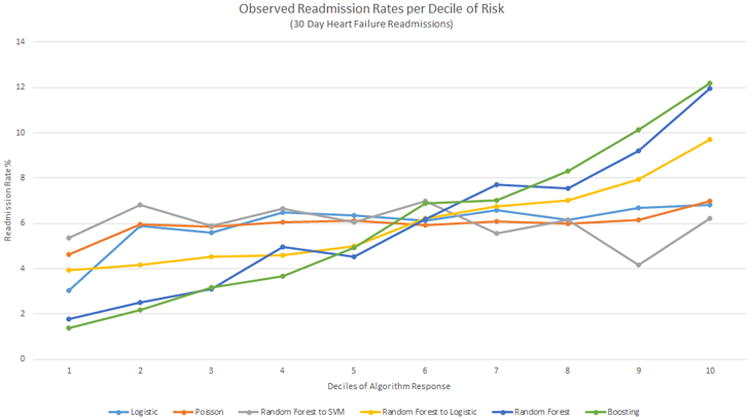
The y-axis presents the observed readmission rates in each decile, the x-axis the ordered deciles of risk predicted. SVM, Support Vector Machine.