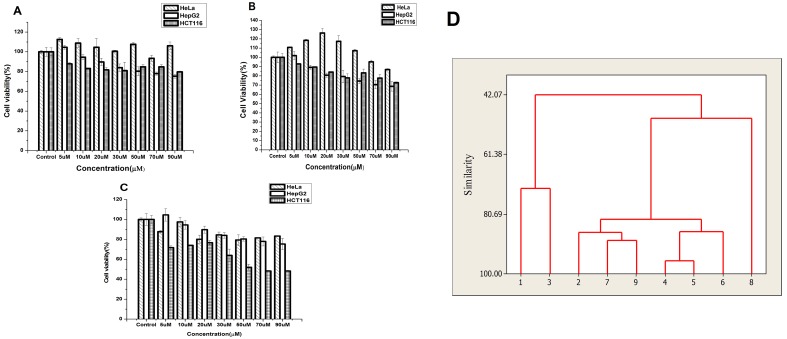
Fig 8. Cell viability plot and dendrogram plot.
A Viability of HeLa cells, HepG2 cells and HCT 116 cells treated with 2-Deoxy-D-Glucose-gold nanoparticles; B Viability of HeLa cell line; HepG2 cell line and HCT116 cells treated with glucose capped gold nanoparticles; C Viability of HeLa cells, HepG2 cells and HCT 116 cells treated with citrate-gold nanoparticles. Standard deviation shown as error bar, p<0.05. D: Dendrogram shows cell lines are aligned separately and grouped based on similarities in their cytotoxicity expression using a hierarchical clustering analysis technique. 1 represents 2DG-AuNp-Hela,2: 2DG-AuNp-HepG2, 3:2DG-AuNp-HCT116, 4:Glu-AuNp-Hela,5:Glu-AuNp-HepG2,6: Glu-AuNp-HCT116,7: Citr-AuNp-Hela,8: Citr-AuNp-HepG2, 9: Citr-AuNp-HCT116.

