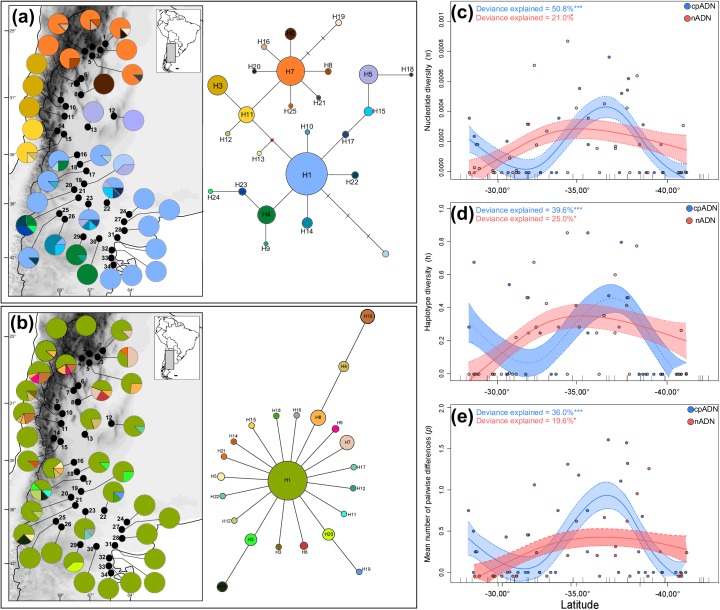
Fig 2.
Geographical distribution, genealogical relationships and spatial patterns of genetic diversity for (a) the chloroplast and (b) the nuclear haplotypes, recovered from 34 populations of Monttea aphylla. On the maps, pie charts reflect the frequency of occurrence of each haplotype in each population. Haplotype colours correspond to those shown in the networks to the right. In the networks, haplotype are designated by numbers, and circle sizes are proportional to haplotype/allele frequencies. Diamond represents a missing intermediate haplotype not observed in the analyzed individuals. (c-e) Non-parametric regression cubic spline using genetic diversity indexes (π, h and p) as response variables and the latitude as the independent variable, performed for chloroplast and nuclear data sets. Dotted lines show ±1 Bayesian standard error intervals (N = 34 locations). The maps shown in (a, b) are reprinted from [31] under a CC BY license, with permission from [DIVA-GIS and Dr. Robert Hijmans; see S1 Doc], original copyright [2005].

