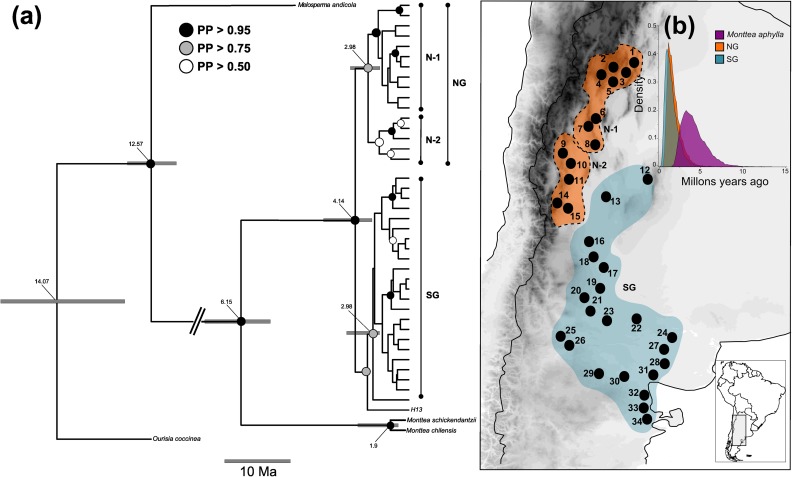
Fig 3.
Evolutionary relationships of Monttea aphylla lineages (a) Maximum clade credibility tree of Monttea aphylla from cpDNA (trnS–trnfM, trnQ–rpL16 and trnH–psbA regions) and nDNA (ITS region) reconstructed using bayesian inference. Posterior probability (PP) values are indicated by node colors and nodes with no indicative of support have pp < 0.50. Numbers given for each node are the estimated (median) divergence time in million years, and grey bars indicate the 95% highest posterior densities over the median value. (b) Posterior density plots of divergence times for Monttea aphylla and each detected genetic group. NG: northern Monte. N-1, N-2: main detected lineages in northern Monte. SG: southern Monte. The map shown in panel (b) is reprinted from [31] under a CC BY license, with permission from [DIVA-GIS and Dr. Robert Hijmans; see S1 Doc], original copyright [2005].

