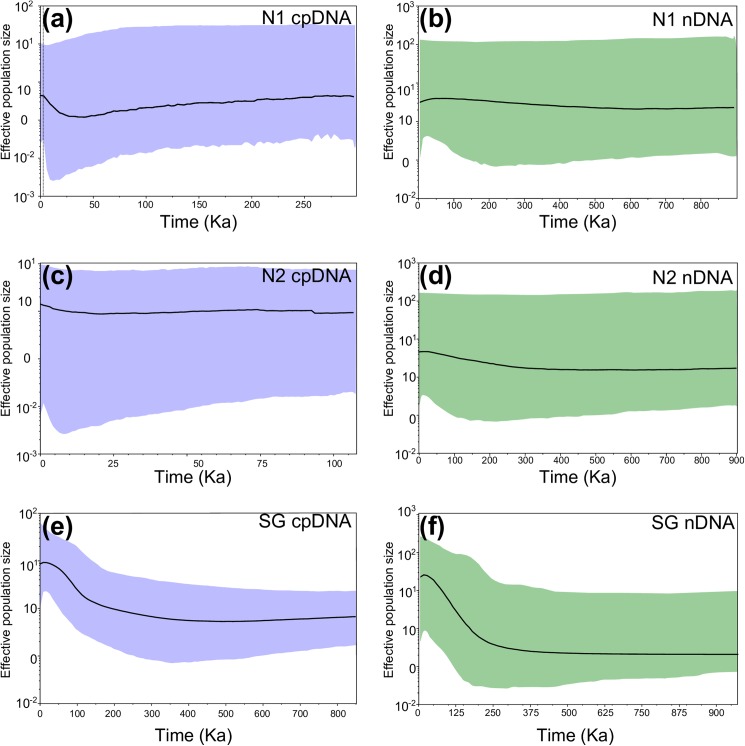
Fig 5. Variation through time in effective population size in Monttea aphylla.
Results based on Bayesian Skyline Plot for each detected genetic groups and for each data set, cpDNA (left column) and nDNA(right column). (a-b) For the N-1 group (c-d) for the N-2 group (e-f) for all localities of southern Monte. The y-axis represents effective population size expressed on a logarithmic scale. Bold lines give the median of effective population size through time and the gray lines represent the 95% highest posterior densities over the median estimates along the coalescent history of the lineages.

