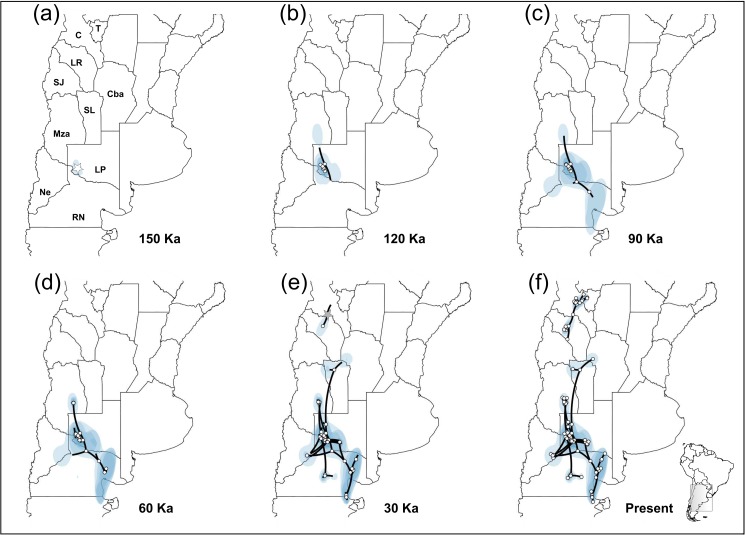
Fig 6. Bayesian spatiotemporal diffusion analysis of Monttea aphylla cpDNA lineages.
Spatial projection of the diffusion pattern through time, based on the maximum clade credibility tree (MCC), estimated with a Bayesian phylogeographic analysis in BEAST (RRW model) at six time slices: (a) 150 Ka. (b) 120 Ka. (c) 90 Ka. (d) 60 Ka. (e) 30 Ka. (f) Present time. The lines represent the branches of the MCC tree. Blue areas represent the 80%-HPD uncertainty in the location of ancestral branches with a gradient from light to dark representing older vs. younger diffusion events. Locations of the expansion origin of each lineage are indicated with starts (gray for N-1 and white for SG). The maps shown are reprinted from [31] under a CC BY license, with permission from [DIVA-GIS and Dr. Robert Hijmans; see S1 Doc], original copyright [2005].

