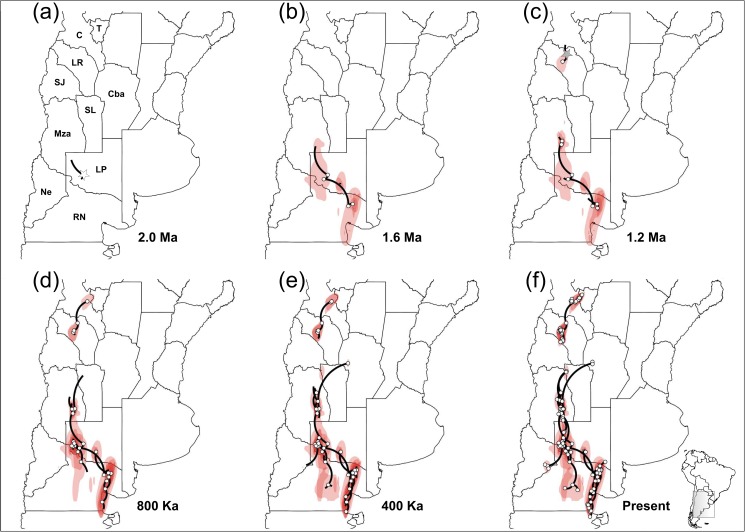
Fig 7. Bayesian spatiotemporal diffusion analysis of Monttea aphylla nDNA lineages.
Spatial projection of the diffusion pattern through time, based on the maximum clade credibility tree (MCC), estimated with a Bayesian phylogeographic analysis in BEAST (RRW model) at six time slices: (a) 2 Ma. (b) 1.6 Ma. (c) 1.2 Ma. (d) 800 Ka. (e) 400 Ka. (f) Present time. The lines represent the branches of the MCC tree. Red areas represent the 80%-HPD uncertainty in the location of ancestral branches with a gradient from dark to light representing older vs. younger diffusion events. Locations of the expansion origin of each lineage are indicated with starts (gray for N-1 and white for SG). The maps shown are reprinted from [63] under a CC BY license, with permission from [DIVA-GIS and Dr. Robert Hijmans; see S1 Doc], original copyright [2005].

