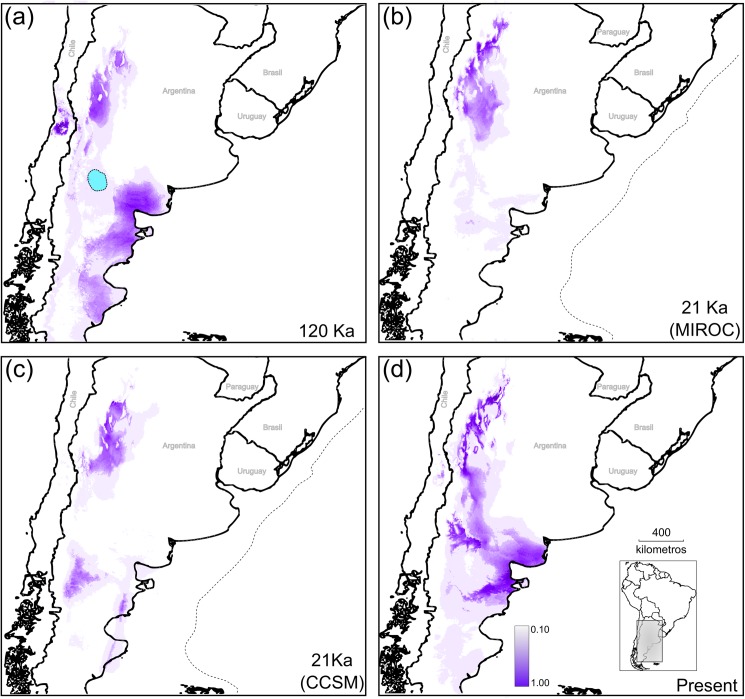
Fig 8. Changes in the potential distribution of Monttea aphylla across Quaternary climatic fluctuations and present climatic.
Potential distributions are shown in gray, in all models darker shading indicates most favourable areas as averaged across 10 cross-validation runs; green shades represent topography, being darker shades higher elevations (a) Potential distribution during the Last Interglacial maximum (LIG). Light-blue polygon over the LIG prediction represent 80% HPD uncertainty for the location of the expansion origin for cpDNA (see Fig 6). Potential distribution during the Last Glacial Maximum (LGM) under CCMS (b) and under MIROC (c) models. (d) Current potential distribution. The dotted lines in b and c represent the extent of land area above sea level, which included the Atlantic continental shelf at the LGM. The maps shown are reprinted from [31] under a CC BY license, with permission from [DIVA-GIS and Dr. Robert Hijmans; see S1 Doc], original copyright [2005].

