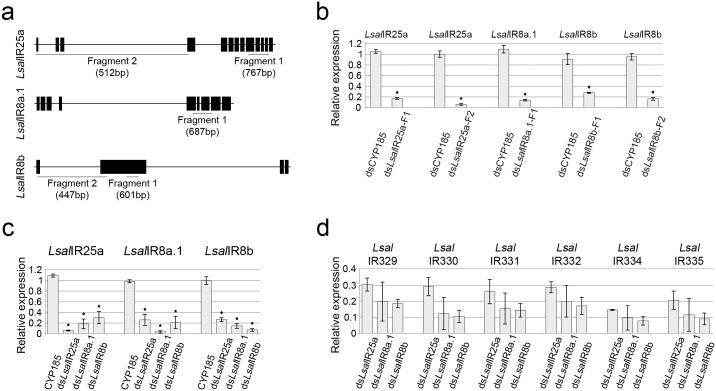
Fig 4. Treatment with dsRNA against co-receptors.
(a) Exon/intron organization of IR co-receptor with underlined regions targeted by dsRNA. Fragments are complementary to exon sequences (black bars) only. Size of each fragments are given in brackets. For LsalIR25a and LsalIR8b two different fragments were used. (b) Silencing efficacy for each tested fragment (F) is presented as a relative expression of targeted gene. Type of treatment is indicated under each bar, and the gene tested above each graph. Error bars shows standard deviation. Each batch contained 100 copepodids, n = 6 and the experiment was repeated 3 times for each gene. Asterisks show significant differences (p < 0,05). Statistical evaluation of differences in mRNA level between the control group and the dsRNA treated group, was performed by Independent-Samples T-Test independently for each gene. (c) Mutual interactions between co-receptors. Expression levels (given as relative expression) for all co-receptors were tested for each dsRNA treatment. The type of dsRNA treatment is given under each bar and tested genes are given above each graph. Error bars indicate standard deviation. Each batch contained 100 copepodids, n = 5. Each experiment was repeated 3 times. Asterisks indicate significant difference (p < 0.05). Statistical evaluation of differences in mRNA level of each gene between the control group and the dsRNA treated group, was performed by Independent-Samples T-Test, for each gene independently. (d) The influence of co-receptors down-regulation on antennal IRs. Six genes show the lowest expression levels in samples treated with dsLsalIR8b. Tested genes indicated above graph, type of treatment stated under each bar. Graphs show relative expression of each gene in comparison to the control, treated with dsCYP185. Expression of each gene in the control sample was set as 1 and omitted in this graph for clarity. Error bars show standard deviation. Each batch contained 100 copepodids, n = 4. Experiment was repeated 4 times.

