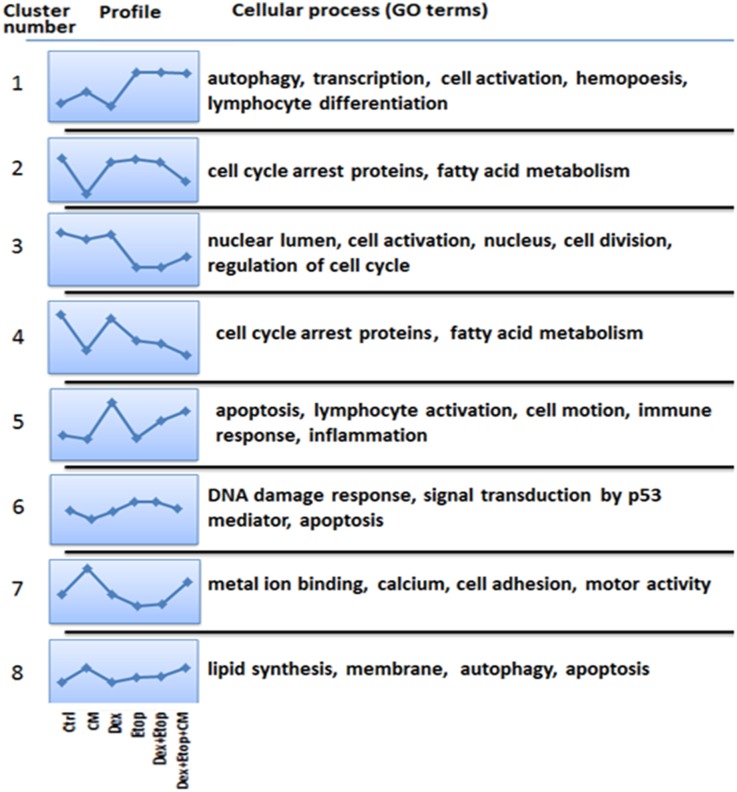
Fig 1. Clusters, profiles, and GO groupings of CEM-C7-14 cells.
CEM-C7-14 cells were grown in the absence and presence of CM or standard RPMI media for 48h and treated with Dex (1μM) and Etop (10μM) individually or in combination for 24h. Cells were treated with vehicle (1), CM (2), Dex (3), Etop (4), Dex and Etop (5) or Dex, Etop and CM (6). Identified genes were assigned to one of eight distinct clusters using k-means clustering algorithms. On the left, the data for each cluster are represented as a profile of the z-transformed, log2 values for the mean of each experimental group/condition. The most significantly overrepresented GO terms are shown for the genes within each cluster.

