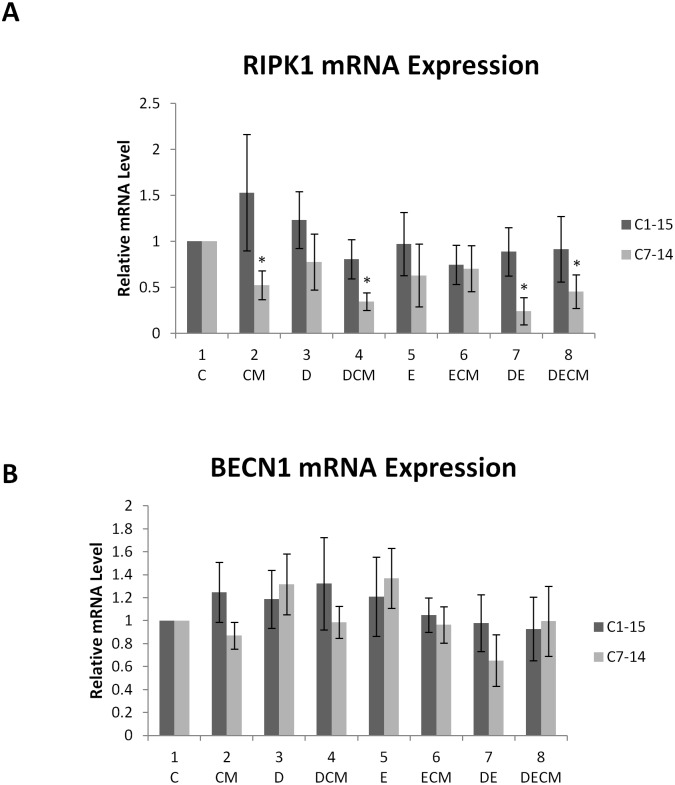
Fig 2. RIPK1 and BECN1 gene expression.
(A) Gene expression of RIPK1 and (B) BECN1 in ALL cells treated with 1μM Dex, and 10μM Etop individually or in combination for 24h in the presence or absence of CM. The data is representative of at least three independent experiments. Error bars represent SEM. P-value of less than or equal to 0.05 is indicated by *.

