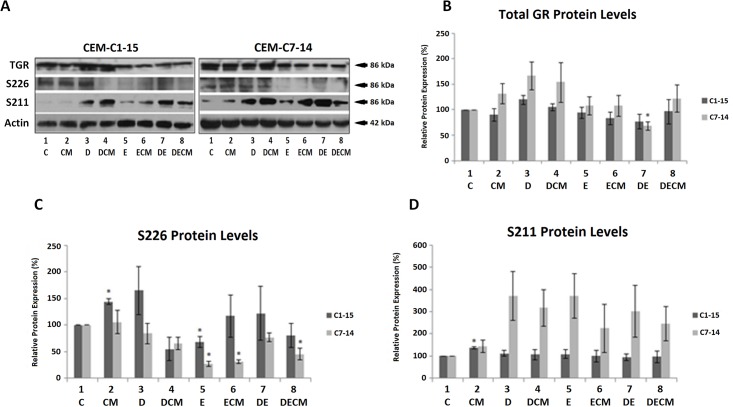
Fig 4. Dex, Etop and the microenvironment affect GR phosphorylation in ALL.
(A) CEM-C1-15 and CEM-C7-14 cells were cultured in CM or standard RPMI media for 48h and treated with Dex (1μM) and Etop (10μM) individually or in combination for 24h. Treatments were as in Fig 2. Cells were lysed and protein extracts were subjected to western blot analysis. Total and phosphorylated GR was detected using specific antibodies against these proteins. Actin was used as loading control. Western blots (Fig 4A and data not shown) were densitometrically scanned, normalised to actin and presented as bar charts. For phosphorylation experiments, phosphorylation blot data was scanned and normalised to the actin-normalised total GR. (B) Total GR protein expression. (C) S226-phosphorylated GR protein expression. (D) S211-phosphorylated GR protein expression. The data is representative of at least three independent experiments. Error bars represent SEM. P-value of less than or equal to 0.05 is indicated by *.

