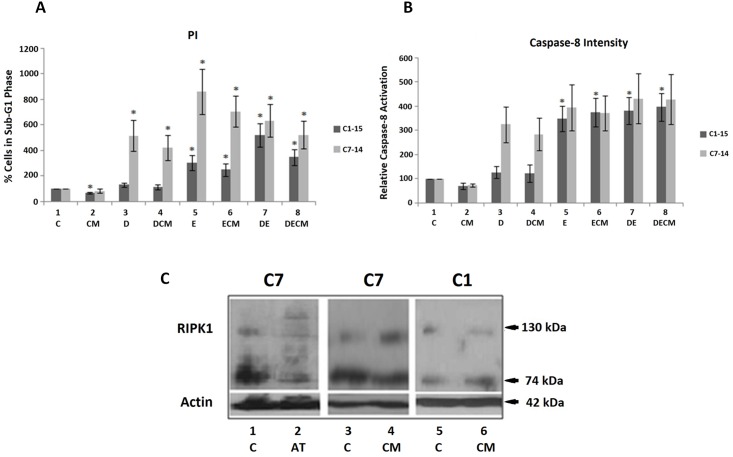
Fig 7. Microenvironment and chemotherapy effects on ALL cell fate.
(A) Cells were treated with CM (48 hours), 1μM Dex (36 hours) and 10μM Etop (24 hours) in varying combinations. Percentage of cell death was obtained using FACS analysis of PI-stained CEM-C1-15 and CEM-C7-14 cells treated as above. SubG1 phase is shown. (B) Caspase-8 activity was measured in ALL CEM-C7-14 and CEM-C1-15 cells treated as indicated. CEM-C1-15 cells are represented by dark grey bars, CEM-C7-14 by light grey bars. (C) RIPK1 high molecular weight forms were analysed in cells treated with CM and BIRC3 inhibitor AT406 (10μM for 48 hours). Western blot analysis was carried out as described above. The data is representative of at least three independent experiments. Error bars represent SEM. P-value of less than or equal to 0.05 is indicated by *.

