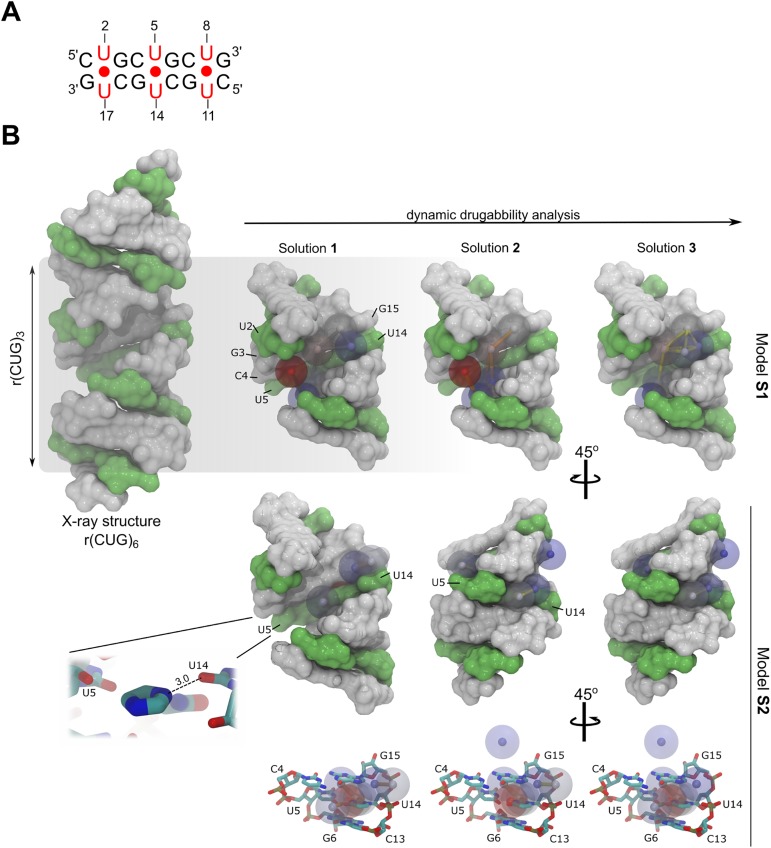
Fig 5.
(A) Schematic representation of the r(CUG)3 model system. (B) Druggability analysis description of the S1 and S2 model systems. RNA is shown as a surface representation with C•G and G•C pairs in white and U-U pairs in green; three druggability solutions were obtained per system. Each druggable region, or hotspot, is represented by a colored sphere (red to blue, from lowest to highest binding-energy, respectively). Notice that the druggable sites in model S1 are distributed along the major groove but are mainly located in the U-U pairs. Model S2 had a stacking interaction pattern caused by the imidazole fragment, which stacks via one U-U pair and forms an H-bond with the O4 atom of U14 (3.0 Å). Some features can also be observed along the minor groove.

