
Figure 3.
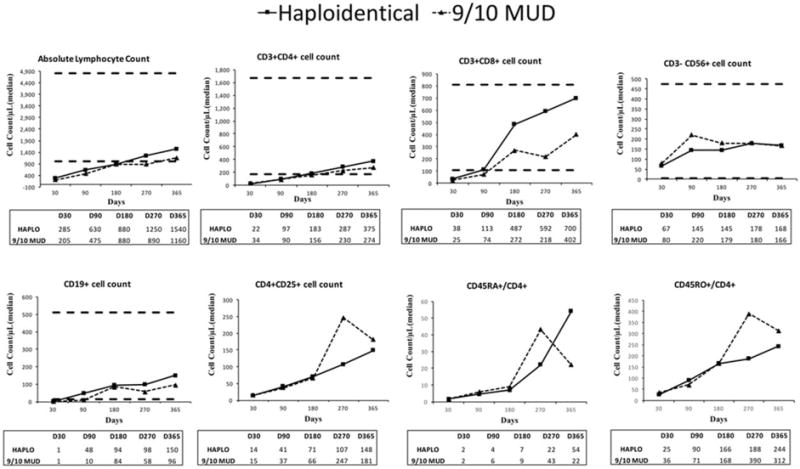
Charts illustrate immune reconstitution of lymphocyte subsets in the haploidentical donor (HAPLO) and 1-antigen human leukocyte antigen-mismatched unrelated donor (9/10 MUD) arms. Median absolute counts of T-lymphocyte subsets, B cells (cluster of differentiation 19-positive [CD19+]), natural killer cells (CD3−/CD56+), and T-regulatory cells (CD4+/CD25+) are shown for each donor type. Horizontal lines in the graphs indicate reference values, and tables below the graphs display median values at different time points. Reference values have not been established for CD4+/CD25+, CD45RA+/CD4+, or CD45RO+/CD4+ cells. D indicates day.