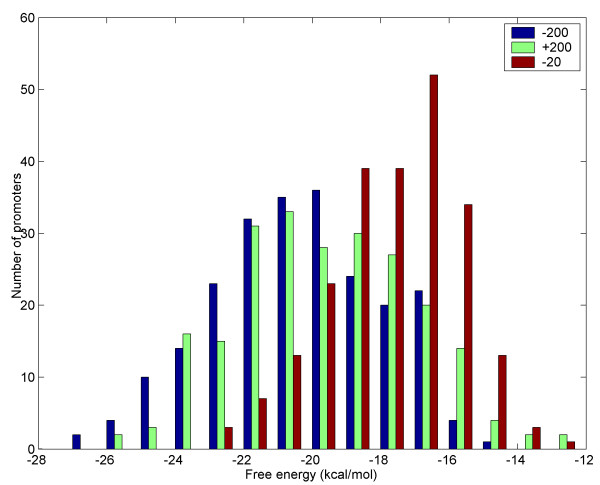
Figure 2.

Histogram showing the free energy distribution corresponding to upstream region (-200), promoter region (-20) and coding region (+200) in E. coli sequences The free energy distribution corresponding to position -20 (calculated for a 15 nt window extending from -20 to -6) is shown as brown bars. Free energy distribution corresponding to positions -200 (calculated for a 15 nt window from -200 to -186, shown in green bars) and +200 (calculated for 15 nt window from +200 to +214, shown in blue bars) are also shown for comparison. Each bar corresponds to 1 kcal/mol. The average free energies corresponding to -20, -200 and +200 positions are -17.48 kcal/mol, -19.42 kcal/mol and -20.19 kcal/mol respectively.
