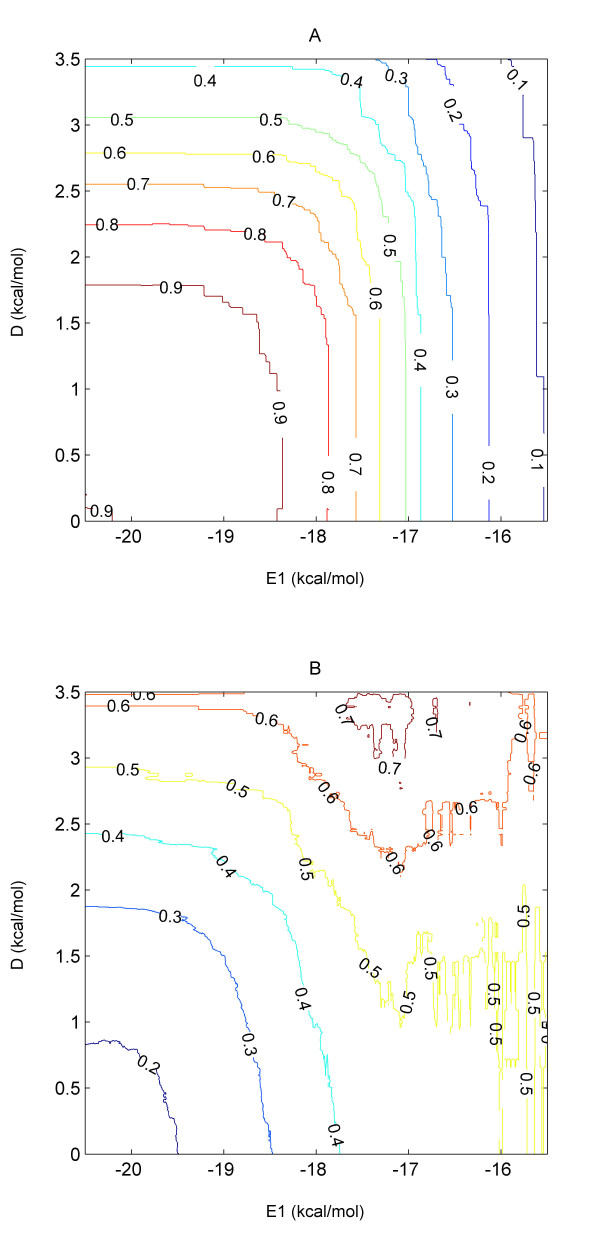
Figure 4.

Sensitivity and precision contour plots The E1 value cut-offs are plotted on x-axis while D value cut-offs are plotted on y-axis. The different A) sensitivity and B) precision levels are shown by colours ranging from dark blue to brown, where dark blue corresponds to lowest value and brown corresponds to highest value.
