Figure 5.

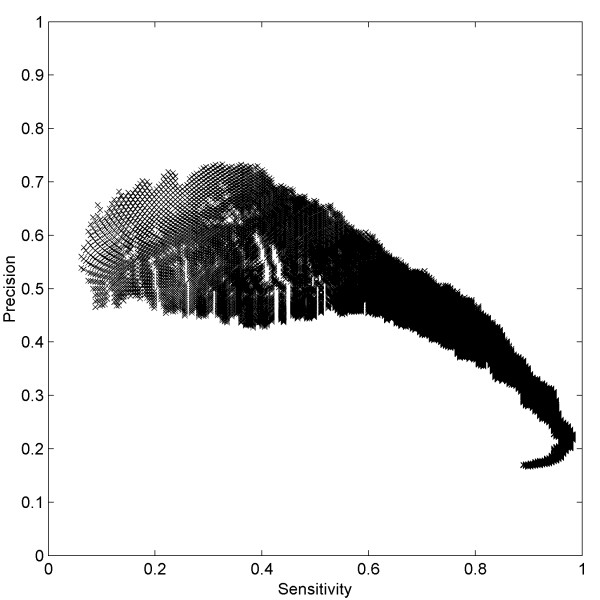
A plot showing range of precision values obtained for a given sensitivity The sensitivity (x-axis) and precision (y-axis) corresponding to different E1 and D cut-offs has been plotted.

A plot showing range of precision values obtained for a given sensitivity The sensitivity (x-axis) and precision (y-axis) corresponding to different E1 and D cut-offs has been plotted.