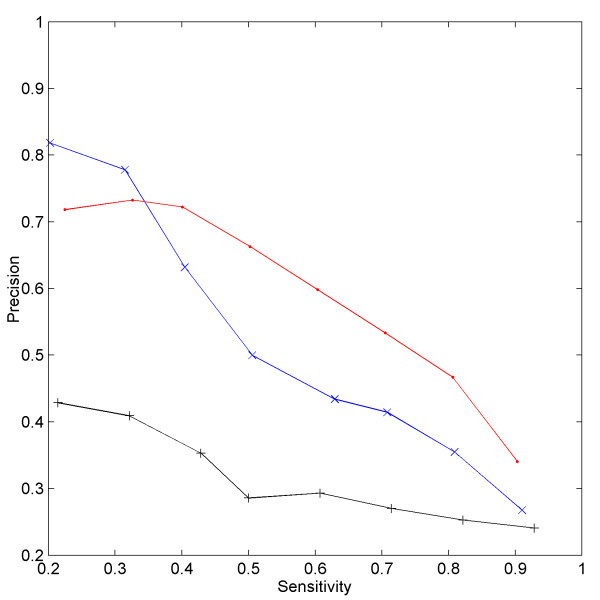
Figure 9.

Prediction accuracy of our method in case of promoters from different organisms The precision (y-axis) of our method in predicting promoter region in different organisms viz. Escherichia coli (red), Bacillus subtilis (blue) and Corynebacterium glutamicum (black) is plotted against various levels of sensitivity (x-axis).
