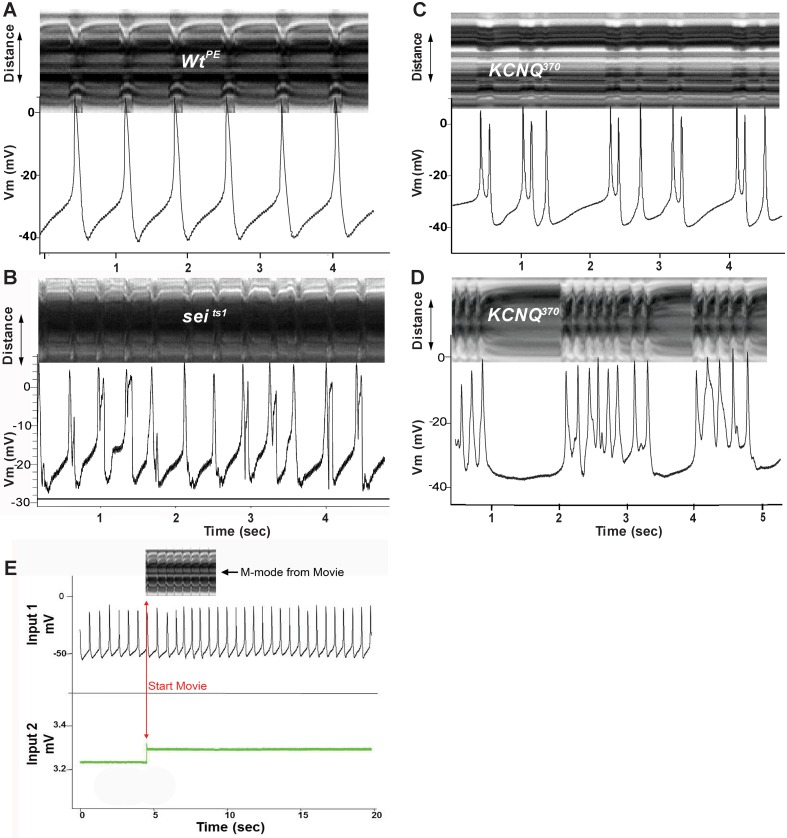
Fig 5. Simultaneous recording of heart wall movements and intracellular action potentials.
M-mode traces (depicting heart wall movement in the y axis, top) were synchronized with intracellular recordings (showing spontaneous voltage changes, bottom) from the hearts of (A) a 1 week old w1118 wildtype fly (B) a 1 week old seits1 mutant (C) a 1 week old KCNQ370 mutant and (D) a 4 week old KCNQ370 mutant. (E) Simultaneous Intracellular / Optical Recording Setup-An intracellular recording from a single myocardial cell in the heart (Input 1) and the voltage trace generated by the optical recording software (Input 2) used to synchronize the optical and electrical recordings. An M-mode from the first four seconds of the movie is shown (top).

