
Figure 2.
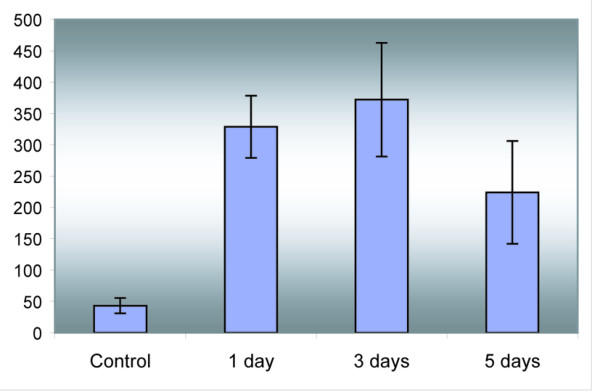
Plasma cortisol levels. The data are mean ± SE (n = 4). Difference between the control and stressed fish is significant (Student's t-test, p < 0.05).
Official websites use .gov
A
.gov website belongs to an official
government organization in the United States.
Secure .gov websites use HTTPS
A lock (
) or https:// means you've safely
connected to the .gov website. Share sensitive
information only on official, secure websites.
Plasma cortisol levels. The data are mean ± SE (n = 4). Difference between the control and stressed fish is significant (Student's t-test, p < 0.05).