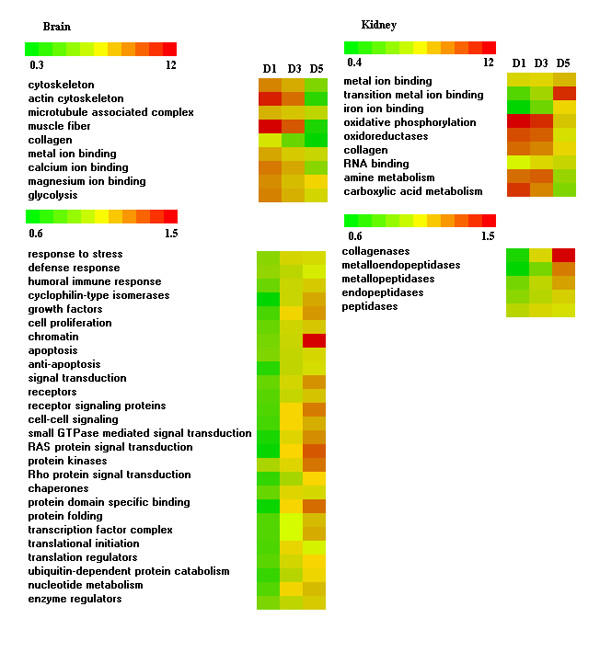
Figure 4.

Time-course of stress response in the brain and kidney. Differentially expressed genes were grouped by the Gene Ontology categories and mean log (expression ratios) were analysed with Student's t-test. Panel presents examples of categories that showed significant difference between the time points (p < 0.05). The values are coded with color scale.
