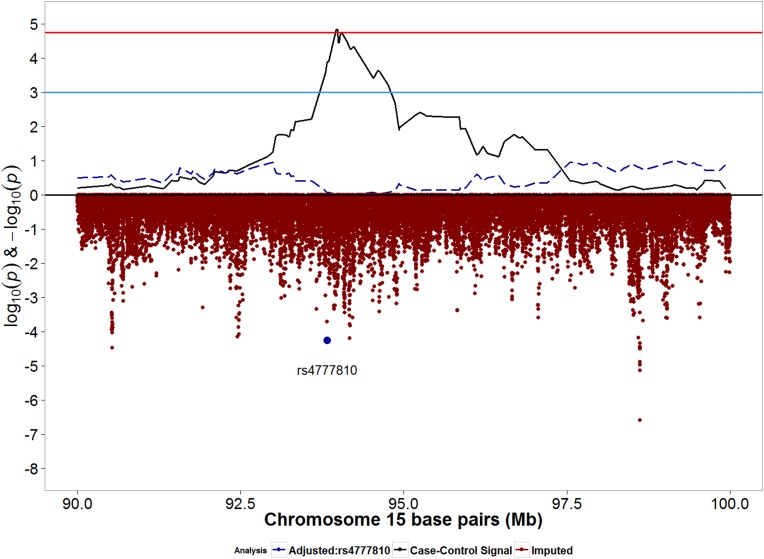
Fig 3. Signals from moderate/severe case-control admixture mapping and imputed SNPs for chromosome 15q26.2 region.
Blue horizontal line: suggestive p-value threshold; Red horizontal line: permutation based p-value threshold. Solid black line represents admixture mapping signal prior to conditional analysis. Red dots represents log10(p-values) for genotyped and imputed SNPs within the admixture mapping peak. Blue dot represents SNP rs4777810, the most significant SNP directly below the admixture mapping peak. Dashed blue line represents admixture mapping signal after adjustment for SNP rs4777810.

