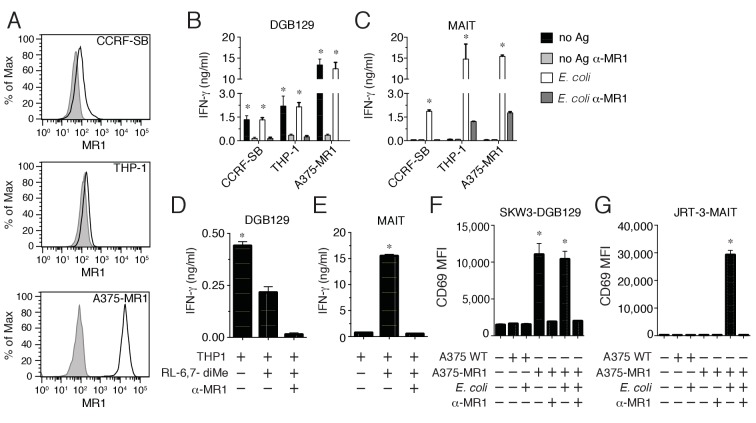
Figure 1. Recognition of non-microbial antigens by MR1-restricted T cells.
(A) Surface expression of MR1 by CCRFSB, THP-1 and A375-MR1 cells. Grey histograms indicate staining with isotype-matched control mAbs. Stimulation of (B) T cell clone DGB129 or (C) MAIT cell clone SMC3 by the three cell lines in A in the absence (no Ag) or presence of E. coli lysate (E. coli) and/or anti-MR1 blocking mAbs (α-MR1). Columns indicate IFN-γ release (mean + SD). Stimulation of (D) DGB129 MR1T or (E) SMC3 MAIT cells by THP-1 cells, constitutively expressing surface MR1, loaded with synthetic 6,7-dimethyl-8-D-ribityllumazine (RL-6,7-diMe) with or without anti-MR1 mAbs. Columns indicate mean IFN-γ release + SD. Stimulation of (F) SKW-3 cells expressing the DGB129 TCR (SKW3-DGB129) or (G) J.RT3-T3.5 cells expressing the MAIT MRC25 clone TCR (J.RT3-MAIT) with A375 cells that expressed (A375-MR1) or lacked (A375-WT) MR1, with or without E. coli lysate and/or anti-MR1 mAbs. CD69 median fluorescence intensity (MFI) ± SD of duplicate cultures of transduced T cells are shown. The CD69 MFI of transduced T cells cultured in the absence of APCs is also shown. Data are representative of four (A, B and C), two (D and E), and three (F and G) independent experiments. *p<0.05 (Unpaired Student’s t-test).

