
Figure 3. Non-MAIT MR1-restricted T cells are readily detectable in the blood of healthy individuals.
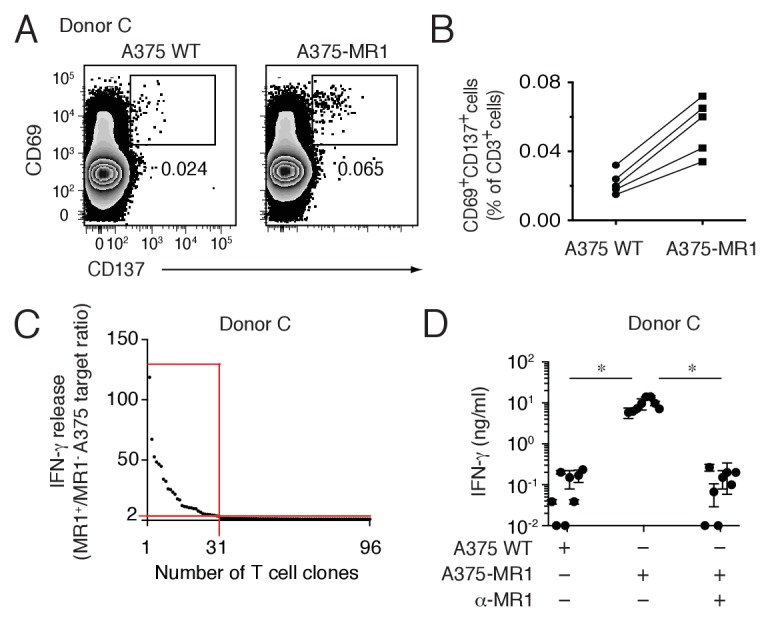
(A) Flow cytometry analysis of purified T cells from a representative donor (Donor C) after overnight co-culture with A375 WT or A375-MR1 cells. Dot plots show CD69 and CD137 expression on live CD3+ cells. Numbers indicate the percentage of cells in the gates. (B) Frequency of CD69+CD137+ T cells from five different donors after overnight co-culture with A375 WT or A375-MR1 cells. (C) Cumulative results of T cell clone stimulation assays from Donor C. T cell clones were generated from CD3+CD69+CD137+ sorted T cells as depicted in A, right dot plot. The graph shows the number of tested clones (x axis) and IFN-γ release (y axis) expressed as ratio between the amount of cytokine secreted in response to A375-MR1 cells vs. A375-WT cells. Each dot represents a single T cell clone, tested at the same time in the indicated experimental conditions. The horizontal red line marks the arbitrary IFN-γ ratio threshold of two above which MR1-dependent T cell clone reactivity was set. The intercept of the vertical red line indicates the number of MR1-restricted T cell clones. Red box highlights T cell clones whose reactivity was MR1-dependent. Results are representative of two independent experiments. (D) Recognition of A375-MR1 but not A375 WT cells in the absence of exogenous antigens by eight representative MR1-restricted T cell clones from Donor C. Inhibition of T cell clone reactivity to A375-MR1 cells by blocking anti-MR1 mAbs (α-MR1). Dots represent the IFN-γ release (mean ± SD of duplicate cultures) by each clone tested in the three experimental conditions. Results are representative of three independent experiments. *p<0.05 (Unpaired Student’s t-test).