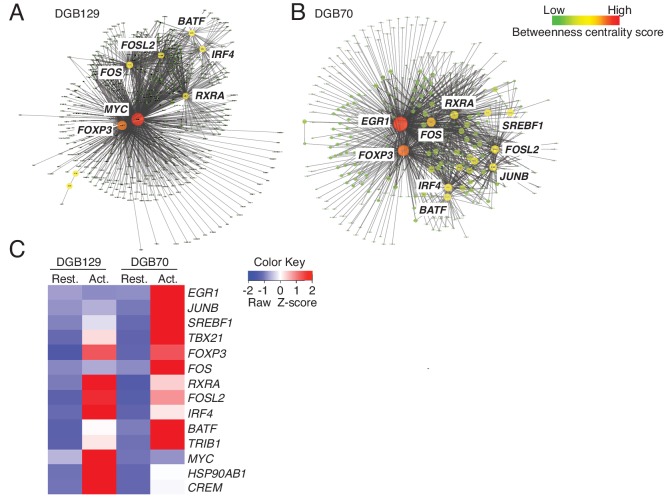
Figure 6. MR1T cell clones exhibit divergent transcriptional responses to antigen stimulation.
Betweeness centrality analysis illustrating the key transcription factors that were differentially expressed in resting (No Ag) and antigen-activated (Ag Act) MR1T cell clones (A) DGB129 and (B) DGB70. Color code represents betweeness centrality score. The size of the nodes (or hubs) indicates the relative importance of individual transcription factors within the whole gene network. (C) Heat-map comparing key transcription factors that were differentially expressed in resting (Rest.) and antigen-activated (Act.) DGB129 and DGB70 MR1T cell clones (analysis performed by PageRank algorithm).


