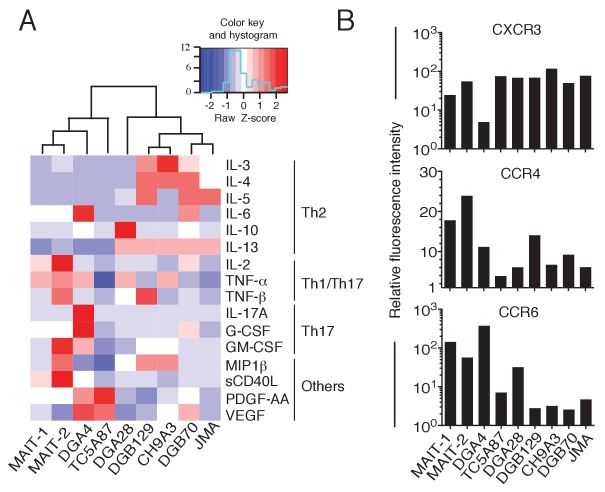
Figure 7. Functional heterogeneity of MR1T cell clones.
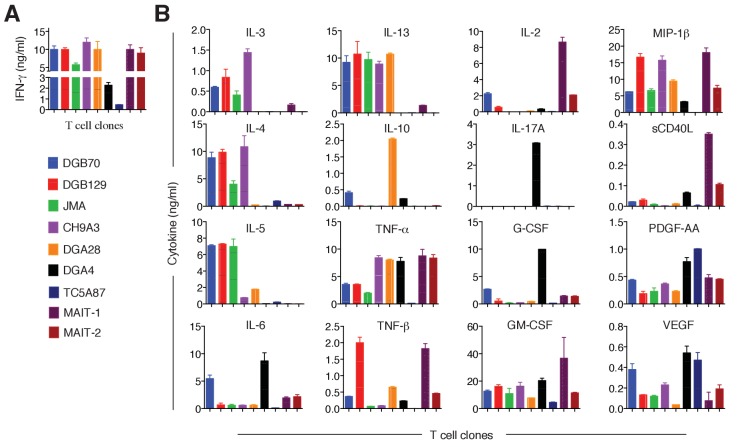
(A) Heat-map of cytokine expression by seven different MR1T cell clones when stimulated by MR1-expressing A375 cells. Also shown are the cytokine profiles of control MAIT cell clones MRC25 (MAIT-1) and SMC3 (MAIT-2) following activation by A375-MR1 cells pulsed with E. coli lysate. Cytokines were assessed in the supernatants of duplicate cultures. The mean value for each cytokine was used to generate the heat-map. Cluster analysis was performed using Pearson correlation. Graphs displaying the amounts of individual cytokines released by the different clones are shown in Figure 7—figure supplement 1. (B) Flow cytometry analysis of CXCR3, CCR4 and CCR6 surface expression by resting MR1T cell clones and 2 MAIT control clones (MRC25, MAIT-1 and SMC3, MAIT-2). Graphs show the relative fluorescence intensity calculated by dividing the median fluorescence intensity (MFI) of specific mAb staining by the MFI of the corresponding isotype control. Data are representative of two independent experiments.


