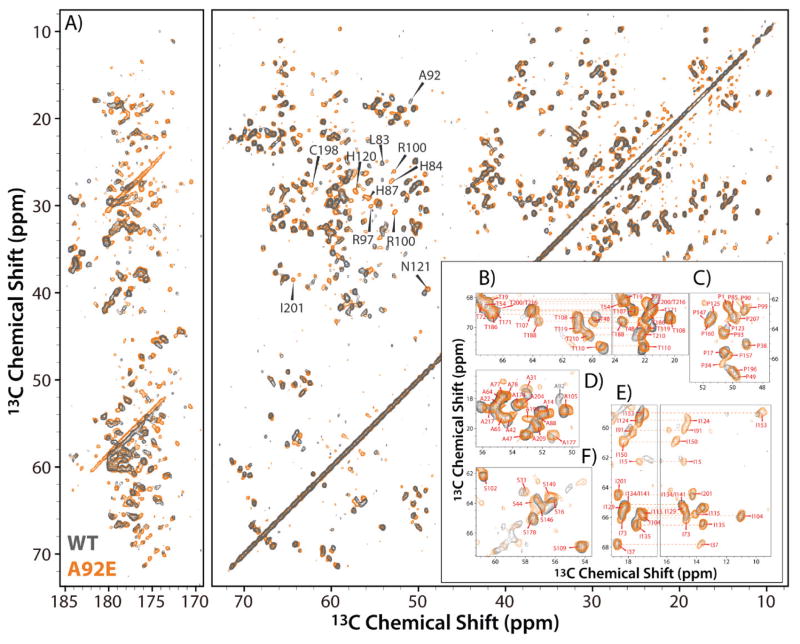
Figure 4.
A) 2D 13C-13C DARR spectrum of tubular assemblies of U-13C,15N-CA A92E (orange) superimposed on the 2D 13C-13C CORD spectrum of U-13C,15N-CA WT (gray), acquired at 19.9 T (850 MHz), using a mixing time of 50 ms. B)–F) Expansions of the DARR spectra for the aliphatic region, comprising Ala, Ile, Ser, and Thr resonances. Note, the excellent spectral resolution: B) Cα-Cβ (left) and Cβ-Cγ2 (right) resonances of Thr residues; C) Cα-Cδ resonances of Pro residues; D) Cα-Cβ resonances of Ala residues; D) Cα-Cγ2 (left) and Cα-Cδ1 (right) resonances of Ile residues; E) Cα-Cβ resonances of Ser residues.

