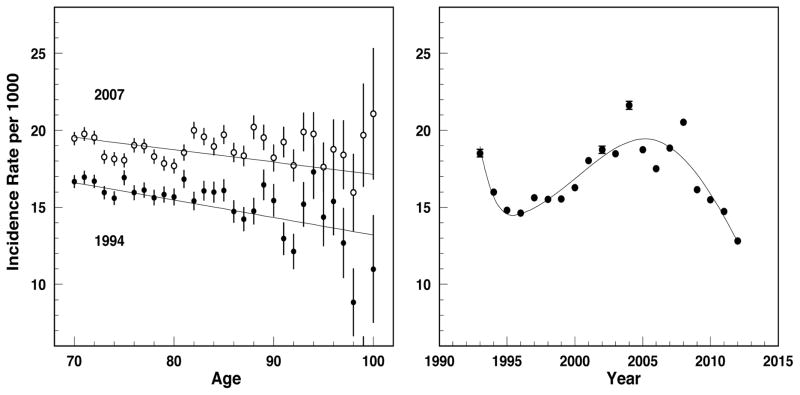
Figure 3.
Incidence rate of type 2 diabetes I(τ, yd): age pattern for selected years of diagnosis (left plot) and year-at-diagnosis patterns for age-adjusted rate (right panel). Dots show empiric estimates and curves show the models: linear model for age-patterns (left plot) and B-spline model for age-adjusted rates (right plot).

