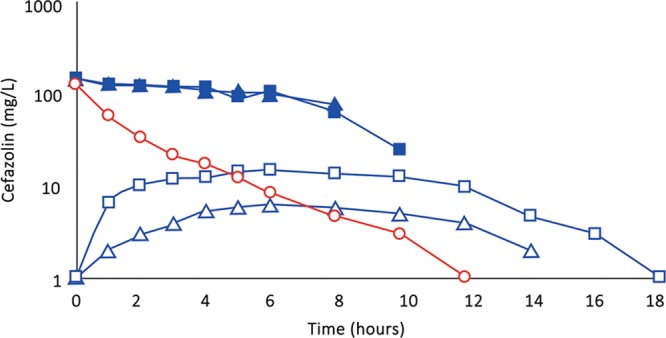
Fig. 3.

(Subject 3): Comparison of concentration–time profiles of cefazolin by IVAD (red) and TAAD (blue) into the hips and outer thighs of a 66.4-kg female. Square symbols represent 870 mg by TAAD1 in a 228 mg/L solution (bilateral). Triangle symbols represent 435 mg by TAAD2 in a 228 mg/L solution (one side). Round symbols show 1,000 mg by IVAD. Closed symbols represent concentrations in TISF, and open symbols are concentrations in serum.
