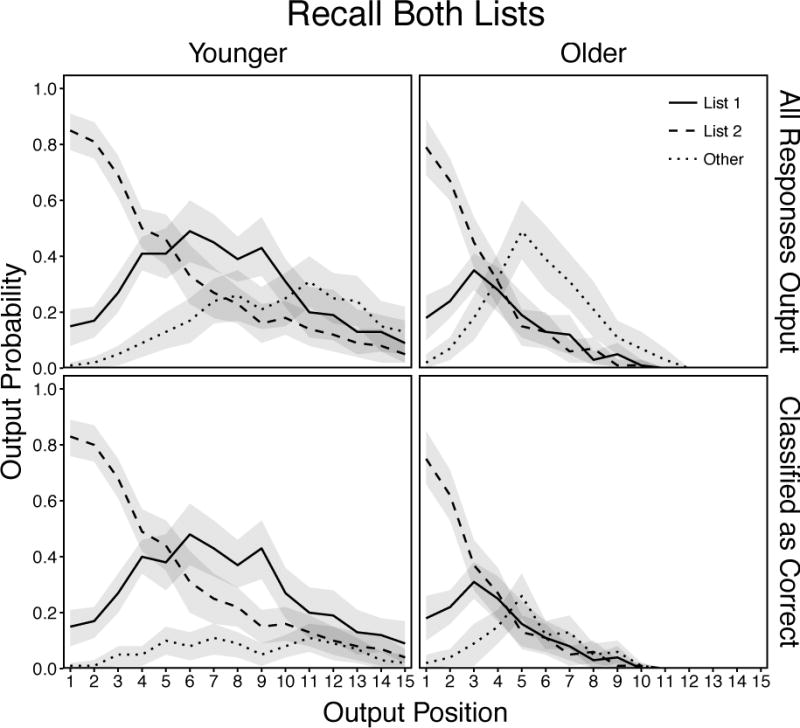
Figure 11.

Mean probabilities of response output as a function of age, response type, and recall position for all responses output (top panels) and only responses classified as correct with confidence judgments or 2 or 3 (bottom panels) in the List Both condition. Responses in the “Other” category include all extra-trial intrusions and repetitions of earlier-output responses. Shaded regions are 95% confidence intervals.
