Figure 3.
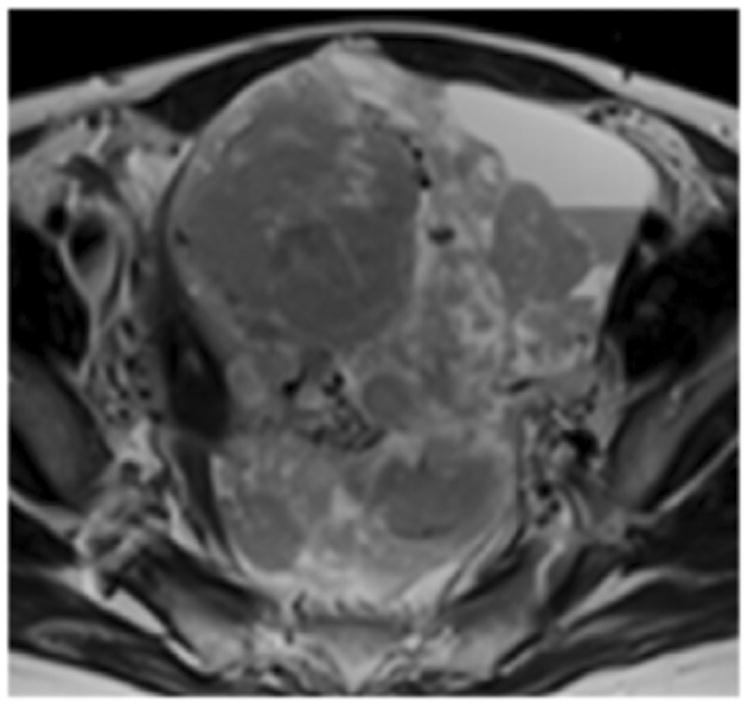
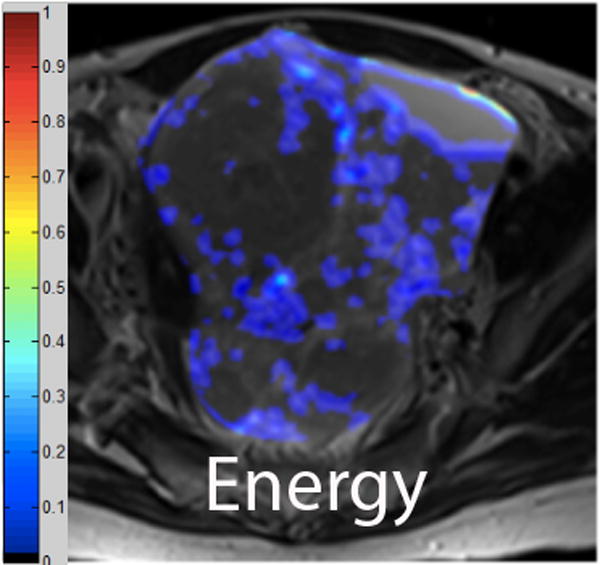
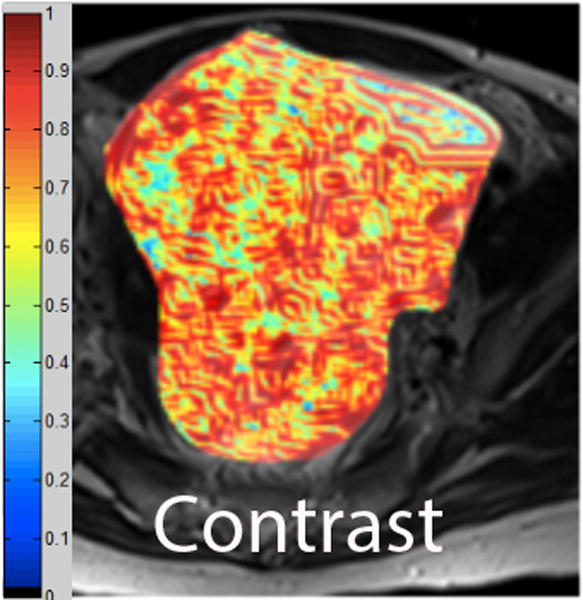
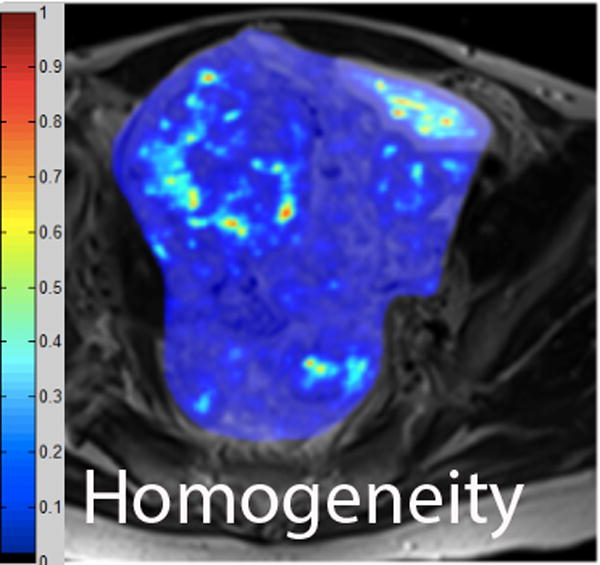
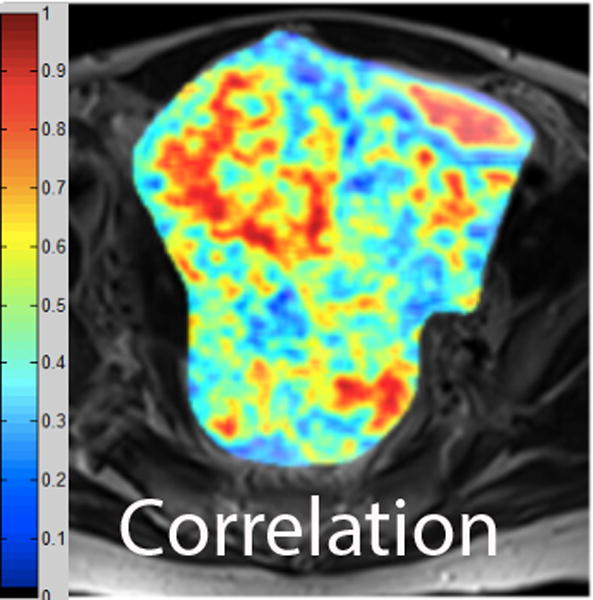
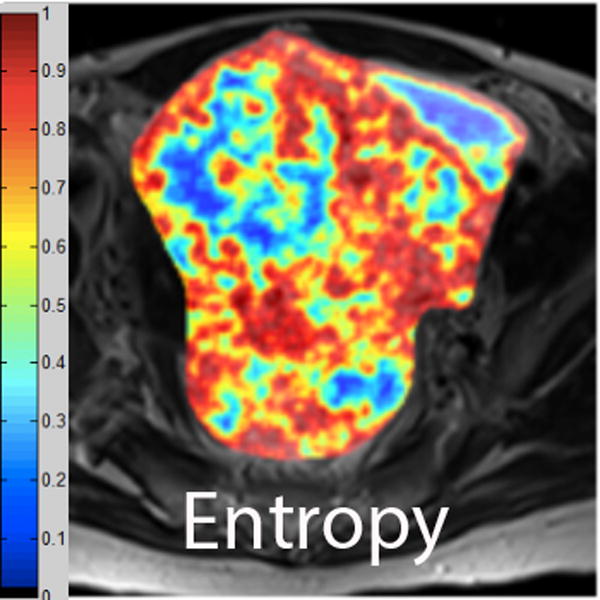
A. Axial T2-weighted image illustrates LMS. B - F. Illustration of the intensity-based texture features (energy, contrast, homogeneity, correlation, and entropy) overlaid on the axial T2-weighted image.


A. Axial T2-weighted image illustrates LMS. B - F. Illustration of the intensity-based texture features (energy, contrast, homogeneity, correlation, and entropy) overlaid on the axial T2-weighted image.