
Figure 4.
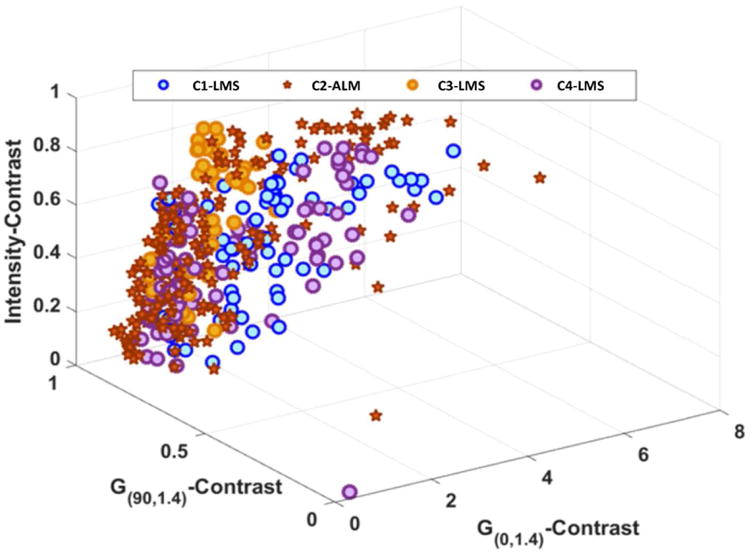
A plot demonstrating the results of self-tuning spectral clustering. To facilitate the ease of illustration, only three of 16 texture features with statistically significant difference between LMS and ALM were used to generate this figure. Self-tuning spectral clustering identified a total of four distinct data clusters (C1 though C4) that comprised of one ALM (star) grouping and 3 LMS (blue, orange, and purple circles) groupings.