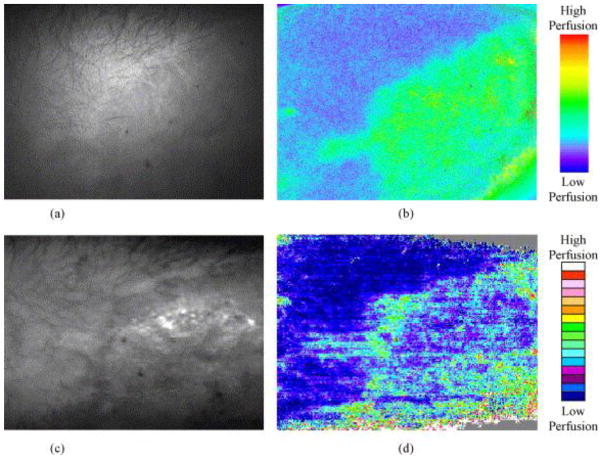
Fig. 15.
Comparison of images from LSI and LDI. (a) photograph of a hypertrophic from LSI CCD camera; (b) LSI image showing tissue perfusion on the same site; (c) Moor LDI total reflected light intensity map of the same site; (d) Moor LDI image showing perfusion of the same site. Figure is adopted with permission from [96].

