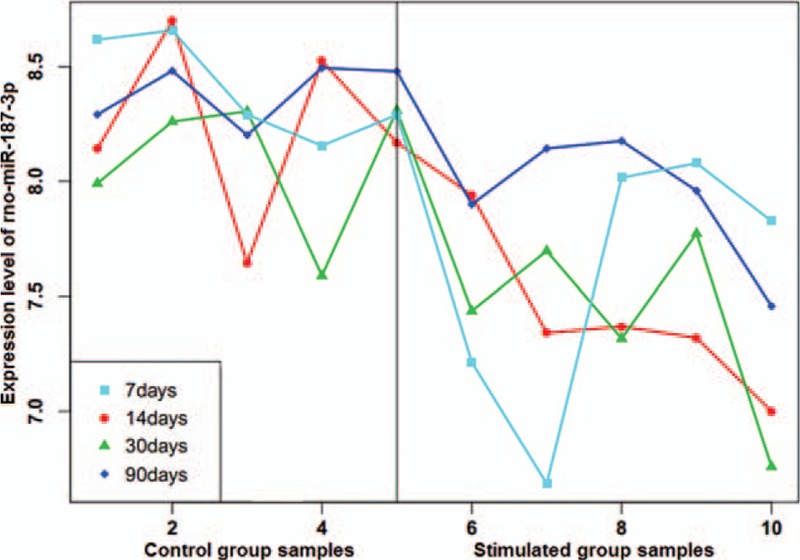
Figure 1.

Expression of rno-miR-187-3p at each time point after electrical stimulation of the amygdala and time-matched controls. As each time point had 5 replicates of each group, the left 5 numbers represent control samples and the right 5 numbers represent stimulated samples.
