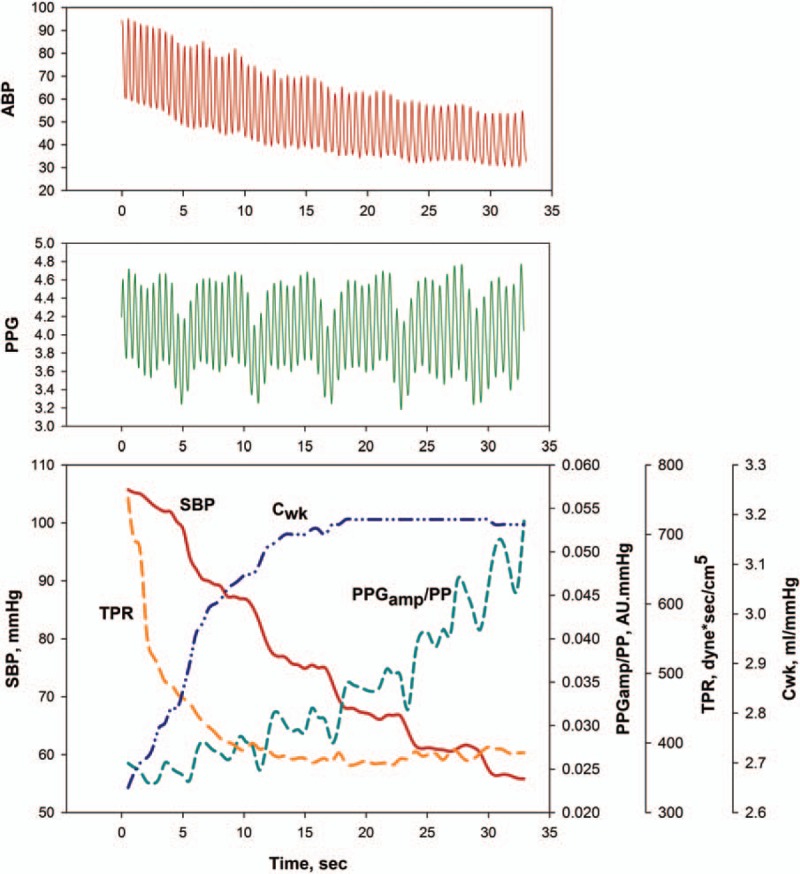
Figure 1.

Example tracing of arterial pressure waveforms (upper panel) and photoplethysmography waveforms (middle panel) and example of serial changes in systolic blood pressure, the ratio of the amplitude of plethysmography to arterial pulse pressure, total peripheral resistance, and arterial Windkessel compliance during hypotension after graft reperfusion. Cwk = arterial Windkessel compliance, PPGamp/PP = the ratio of the amplitude of plethysmography to arterial pulse pressure, SBP = systolic blood pressure, TPR = total peripheral resistance.
