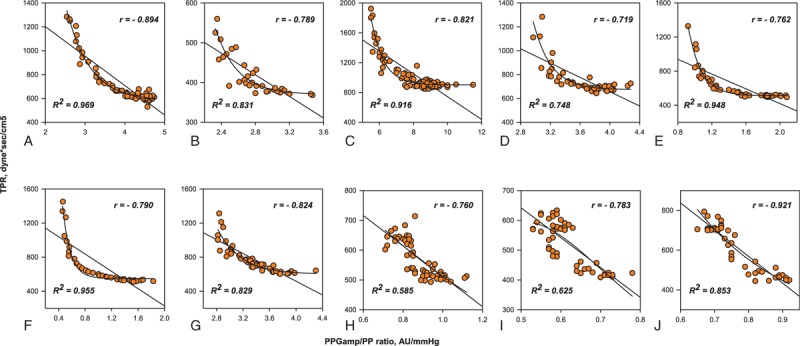
Figure 2.

Individual data for the linear and curvilinear relationships between the ratio of the amplitude of plethysmography to arterial pulse pressure and total peripheral resistance. AU = arbitrary unit, PPGamp/PP = the ratio of the amplitude of plethysmography to arterial pulse pressure, TPR = total peripheral resistance.
