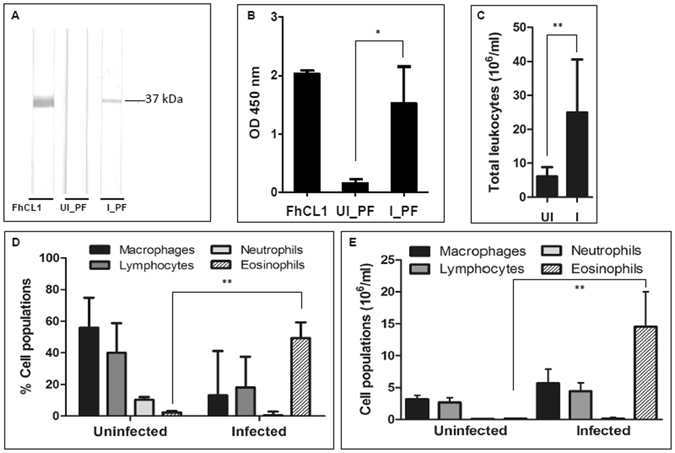
Figure 3.

Peritoneal fluid humoral and cellular analysis. (A) Detection of F. hepatica cathepsin L1 (FhCL1) specific antibodies in peritoneal fluid by immunoblotting. Lane 1: FhCL1 positive control; Lane 2: peritoneal fluid from the uninfected pool (UI_PF); Lane 3: peritoneal fluid from the infected pool (I_PF). (B) IgG level response in peritoneal fluid against F. hepatica cathepsin L1 (FhCL1). 1: FhCL1 positive control; 2: uninfected (UI_PF); 3: infected (I_PF). (C) Total mean cell count per ml in the peritoneal fluid from the uninfected (UI) and infected (I) groups (n = 5; ± standard deviation is represented). (D) Mean differential cell count showing the percentages of macrophages, lymphocytes, neutrophils and eosinophils in the peritoneal fluid of uninfected and infected sheep (n = 5; ± standard deviation is represented). (E) Mean differential cell count of macrophages, lymphocytes, neutrophils and eosinophils in the peritoneal fluid of uninfected and infected sheep (n = 5; ± standard deviation) represented by cell number. *P value < 0.05; **P value < 0.01.
