
Figure 2.
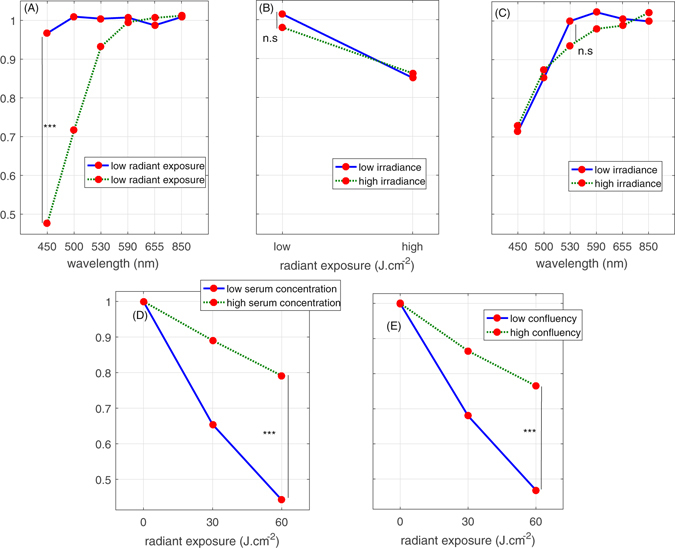
Interactions plot between the wavelength, radiant exposure, irradiance, cell confluency and serum concentration and their relative impact on human dermal fibroblasts metabolic activity. Interactions between wavelength and radiant exposure (A), irradiance and radiant exposure (B) and irradiance and wavelength (C) and their relative impact on human dermal fibroblasts metabolic activity (reticular and papillary). Data points correspond to grand means, i.e. the average value of the metabolic activity for each level of two selected factors (wavelength and radiant exposure, radiant exposure and irradiance or wavelength and irradiance) while all the levels of the remaining factor are averaged. Statistical significance was evaluated using ANOVA (N = 3, 2 lineages and 3 replicates). The levels of radiant exposure correspond to 2 J.cm−2 (low) and 30 J.cm−2 (high), the levels of irradiance depended on wavelength and are reported in Table 1 in the Materials and Methods Section. Interactions between levels of radiant exposure of 450 nm light and serum concentration (D), and initial confluency (E) and their impact on the relative response of the metabolic activity of human dermal fibroblasts. Data points correspond to grand means, i.e. the average value of the metabolic activity for each level of two selected factors (radiant exposure and serum concentration or radiant exposure and confluency) while all the levels of the remaining factor are averaged. Statistical significance was evaluated using ANOVA (N = 2, 2 lineages and 3 replicates). The initial ratio at the moment of seeing between ‘high’ and ‘low’ confluency groups is 5. The control group has an average relative metabolic activity of 1.