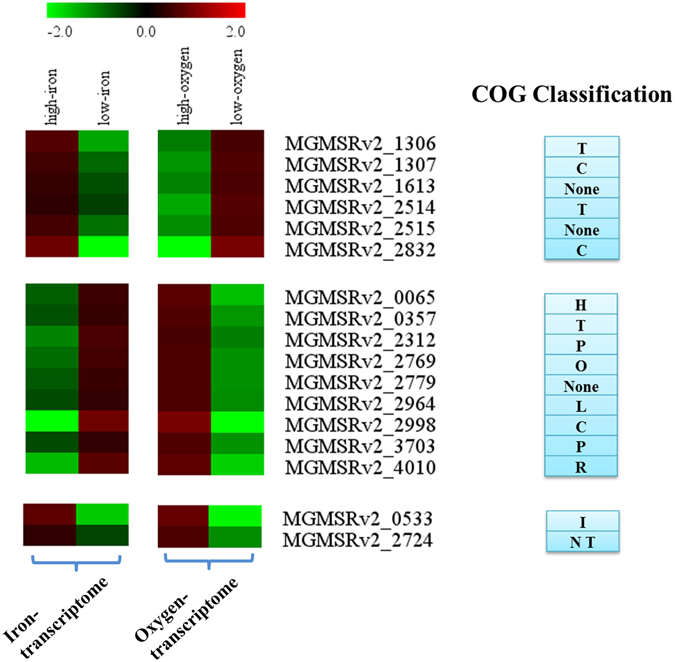
Figure 5.

Classification of DEGs from comparison of iron- and oxygen-transcriptome. Hierarchical clustering (HCL) was performed using the Multi Experiment Viewer program, V. 4.8.1. Each expression element was typically the log2 transformation of an expression fold change between high- vs. low-iron or high- vs. low-oxygen conditions. 17 DEGs were divided into three groups (left), and corresponding COG designations are shown (right). Descriptions of COG classifications are shown in Table S4.
